How to Add Telemetry to an Azure Data Studio Extension
This post will go through an example of adding telemetry collection to a basic Azure Data Studio extension – where you would be able to analyze the extension’s usage patterns. I won’t even begin talking about the technical details of implementing telemetry data collection without mentioning the importance of clearly disclosing the usage data that is being collected. Even for an open source project, a privacy statement in plain language should be shared if telemetry data is collected.
One of the most streamlined ways to implement telemetry collection is to avoid reinventing the wheel and leverage a currently available module – the VS Code Extension Telemetry module. The module will send telemetry data to an Application Insights instance based on a key placed in the application.
Setup Application Insights for your Telemetry
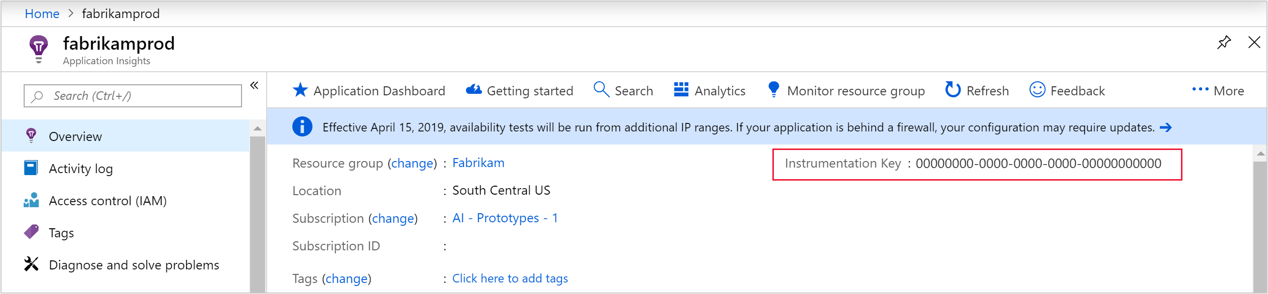
Head on over to your Azure Portal and navigate through Create a resource > Developer tools > Application Insights. The resource group, instance name, and region are up to you – what we’re going to need is the instrumentation key that is displayed on the Application Insights overview page when it completes deployment.
In the example below, we will place the key directly in the code. Don’t push this sample code to a public repo! This instrumentation key should be treated like any API key and guarded. In a future post, I will provide a quick method for protecting API keys in Azure Data Studio extensions.
Using the VS Code Extension Telemetry Module
Adding a module from npm to an extension can be done in the VS Code terminal in the project through the command npm install vscode-extension-telemetry. Ahead of the activate function in your extension, set a few constants for the telemetry collection:
import * as vscode from 'vscode';

import TelemetryReporter from 'vscode-extension-telemetry';
const extensionId = 'publisher.identifierfortheextension';
const extension = vscode.extensions.getExtension(extensionId);
const extensionVersion = extension.packageJSON.version;
const key = 'your-tele-metry-keyy-here';
let reporter;

export function activate(context: vscode.ExtensionContext) {
Within the activate function, you instantiate the telemetry collection by creating a TelemetryReporter and send an initial telemetry event that indicates the extension was activated:
export function activate(context: vscode.ExtensionContext) {

    reporter = new TelemetryReporter(extensionId, extensionVersion, key);
    context.subscriptions.push(reporter);

    reporter.sendTelemetryEvent('activated', { }, { });
Telemetry events can be sent throughout your extension, such as within commands, with additional information. The second parameter in the function sendTelemetryEvent() is an object of string properties and the third parameter is an object for numeric properties. For example:
reporter.sendTelemetryEvent('demomodeenabled', {'propertyA': 'thevalue', 'propertyB': 'theothervalue'}, {'demoFontSize': 18});
Before we’re done we need to ensure that our extension will take out its garbage, and add a dispose() function on the TemeletryReporter object to the deactivate function:
function deactivate() {
   reporter.dispose();
}
Respect Your Users
You can/should detect if your users have opted out of telemetry for the application by accessing the workspace configuration (settings).
The following is my original implementation… jump ahead for an improved approach .
Ahead of the extension activate function, check if telemetry has been opted-out:
var theSettings = vscode.workspace.getConfiguration();
const telemetryOn:boolean = ( theSettings.get('telemetry.enableTelemetry') );
Grabbing the telemetry setting into a constant allows you to wrap each telemetry call in an if statement, such as:
if ( telemetryOn ) {
    reporter.sendTelemetryEvent('activated', { }, { });
}
Update! Improved Implementation
Charles-Gagnon provided some excellent feedback via GitHub – the above implementation requires an application restart to take effect. That is not a modern UI expectation and the adjustment to live settings update isn’t too difficult. The options to implement immediate changes to telemetry based on application settings are:
- Listen for settings updates, as modeled here.
- Fetch the settings with each telemetry call, similar to the Demo Mode enable command.
In Demo Mode, and other extensions, I’ve opted for an adaptation of option #2. In this instance the telemetry call and surrounding check on the current settings are wrapped in a helper class with the following function:
public sendTelemetry(eventName:string, stringObj:any, numericObj:any) {
    var theSettings = vscode.workspace.getConfiguration();
    if  ( theSettings.get('demomode.telemetry') && theSettings.get('telemetry.enableTelemetry') ) {
        this.reporter.sendTelemetryEvent(eventName, stringObj, numericObj);
    }
}
The function sendTelemetry() mirrors the sendTelemetryEvent() function from vscode-extension-telemetry – similar parameters – but handles the privacy settings as the last step before sending the telemetry.
Getting to the Data

Back in the Azure Portal, scroll down the left-hand list in your Application Insights instance to locate the Logs (Analytics) item. This interface allows you to quickly get hands-on with the telemetry data and use a query language against the collection.
<p>
Start with the sample query against <em>customEvents</em> and go to town!
</p><figure class="wp-block-image size-large">
<img decoding="async" loading="lazy" width="740" height="319" src="https://drewsktech.blob.core.windows.net/images/wp-content/uploads/2019/11/customEvents.png?resize=740%2C319&ssl=1" alt="" class="wp-image-669" srcset="https://drewsktech.blob.core.windows.net/images/wp-content/uploads/2019/11/customEvents.png?w=812&ssl=1 812w, https://drewsktech.blob.core.windows.net/images/wp-content/uploads/2019/11/customEvents.png?resize=300%2C129&ssl=1 300w, https://drewsktech.blob.core.windows.net/images/wp-content/uploads/2019/11/customEvents.png?resize=768%2C331&ssl=1 768w" sizes="(max-width: 740px) 100vw, 740px" data-recalc-dims="1" /><figcaption>Query interface in Log (Analytics)</figcaption></figure>
Resources
For a complete but simple extension with telemetry implemented, check out the Demo Mode extension for Azure Data Studio: https://github.com/dzsquared/demo-mode/blob/master/src/extension.ts